Introduction
Following is the key learning from the book Moving Average Pro101
What is the use of moving average ?
- Moving averages are used to identify the trend
- Can be used with Support and Resistance, RSI, MACD, Bollinger Bands, etc
- Moving averages are an unbiased trend indicator
- Types of Moving Averages
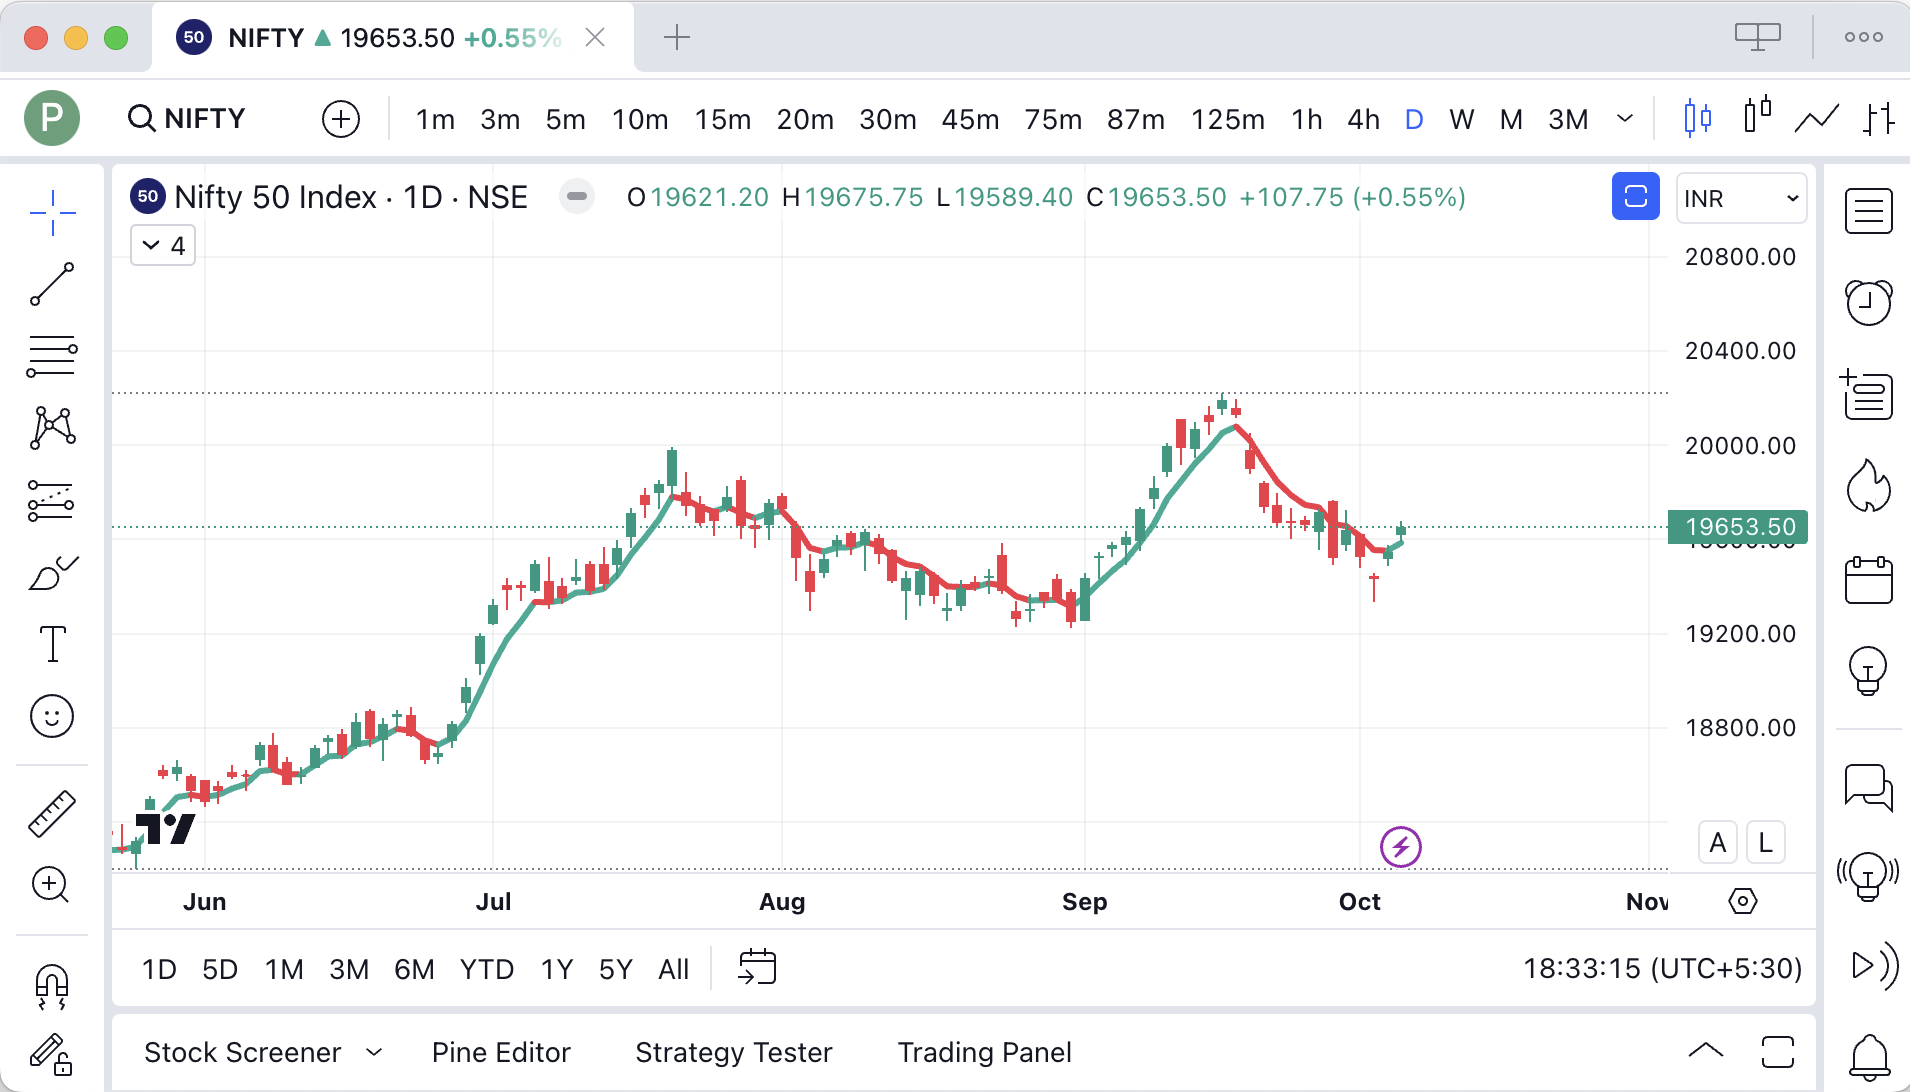
5 Day EMA
- Sign of Strong Momentum
- Support in a strong uptrend
- Can be used in low volatility
- Can act as Trailing Stop Loss for day
- Bounce back from this line is a trend continuation
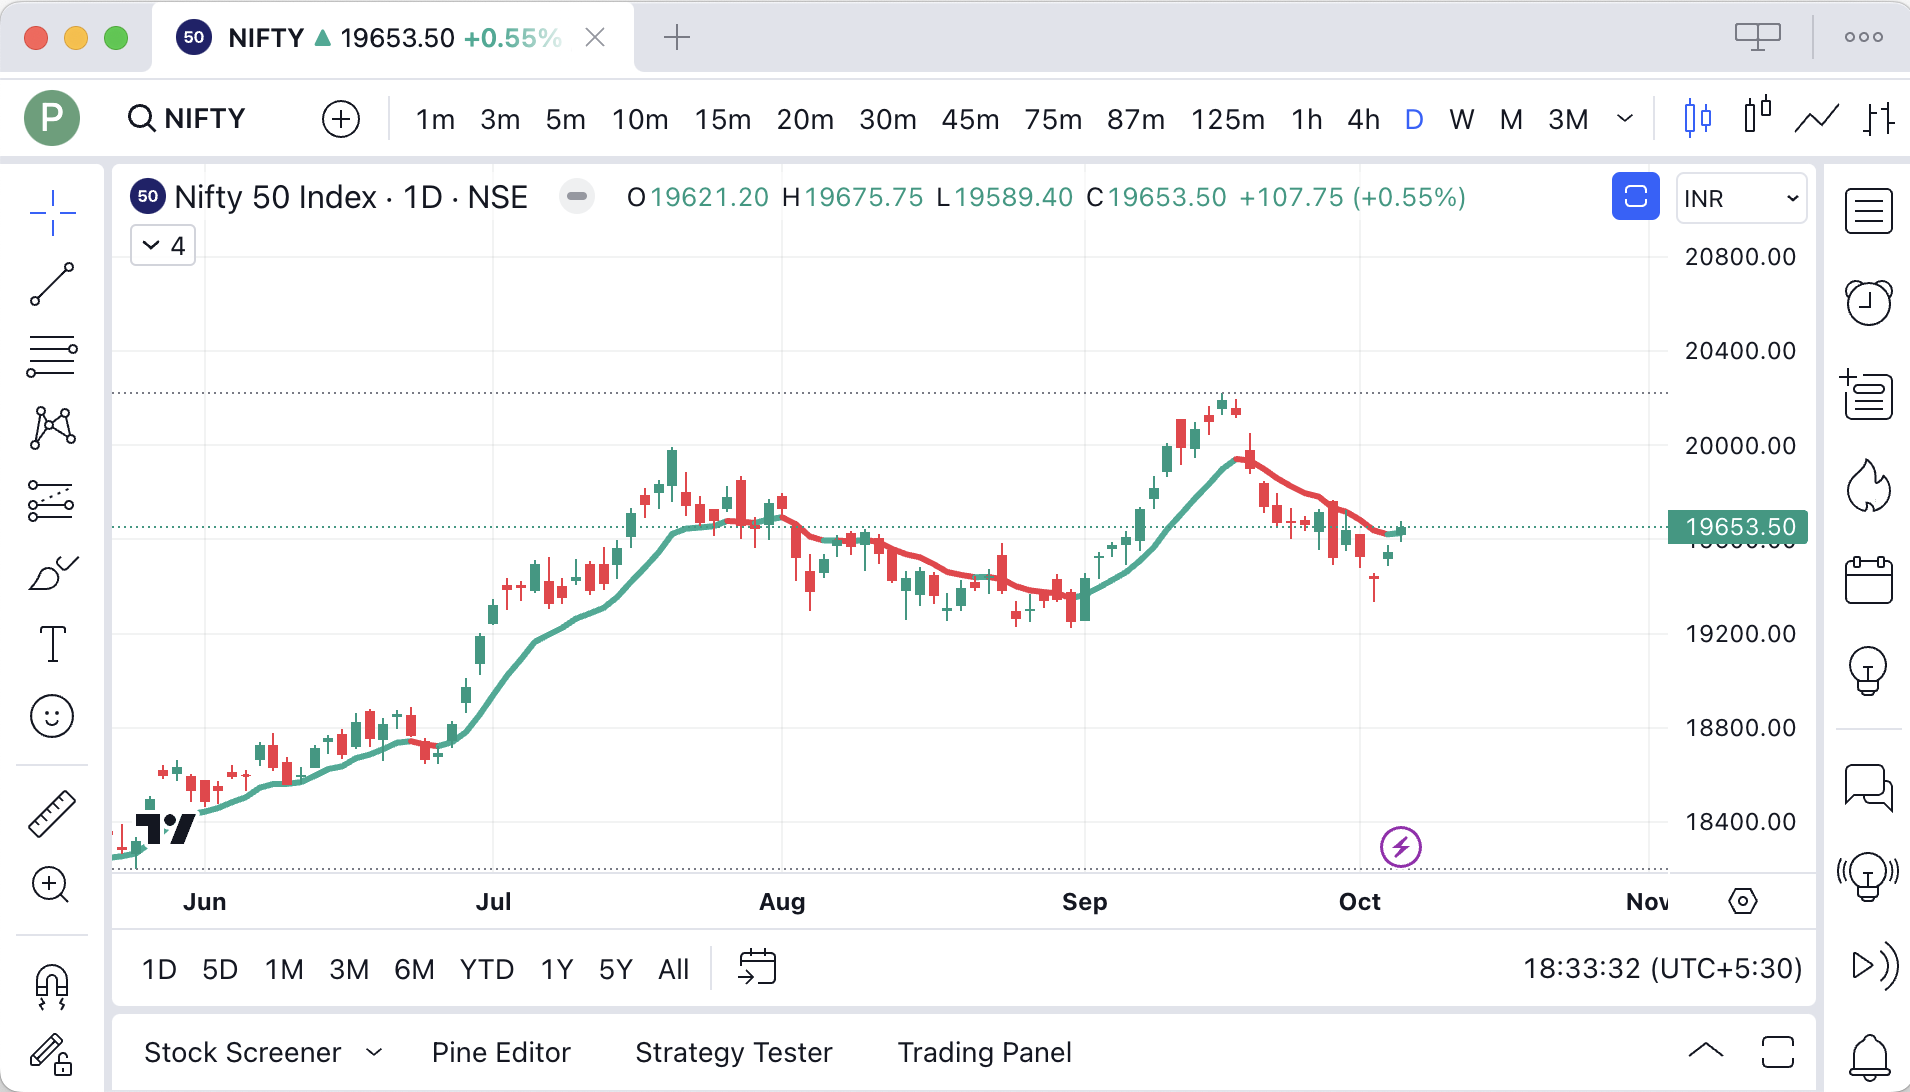
10 day EMA
- Decide the right side of the market, long or short
- If stock breaks below this then may be an indication of a downtrend
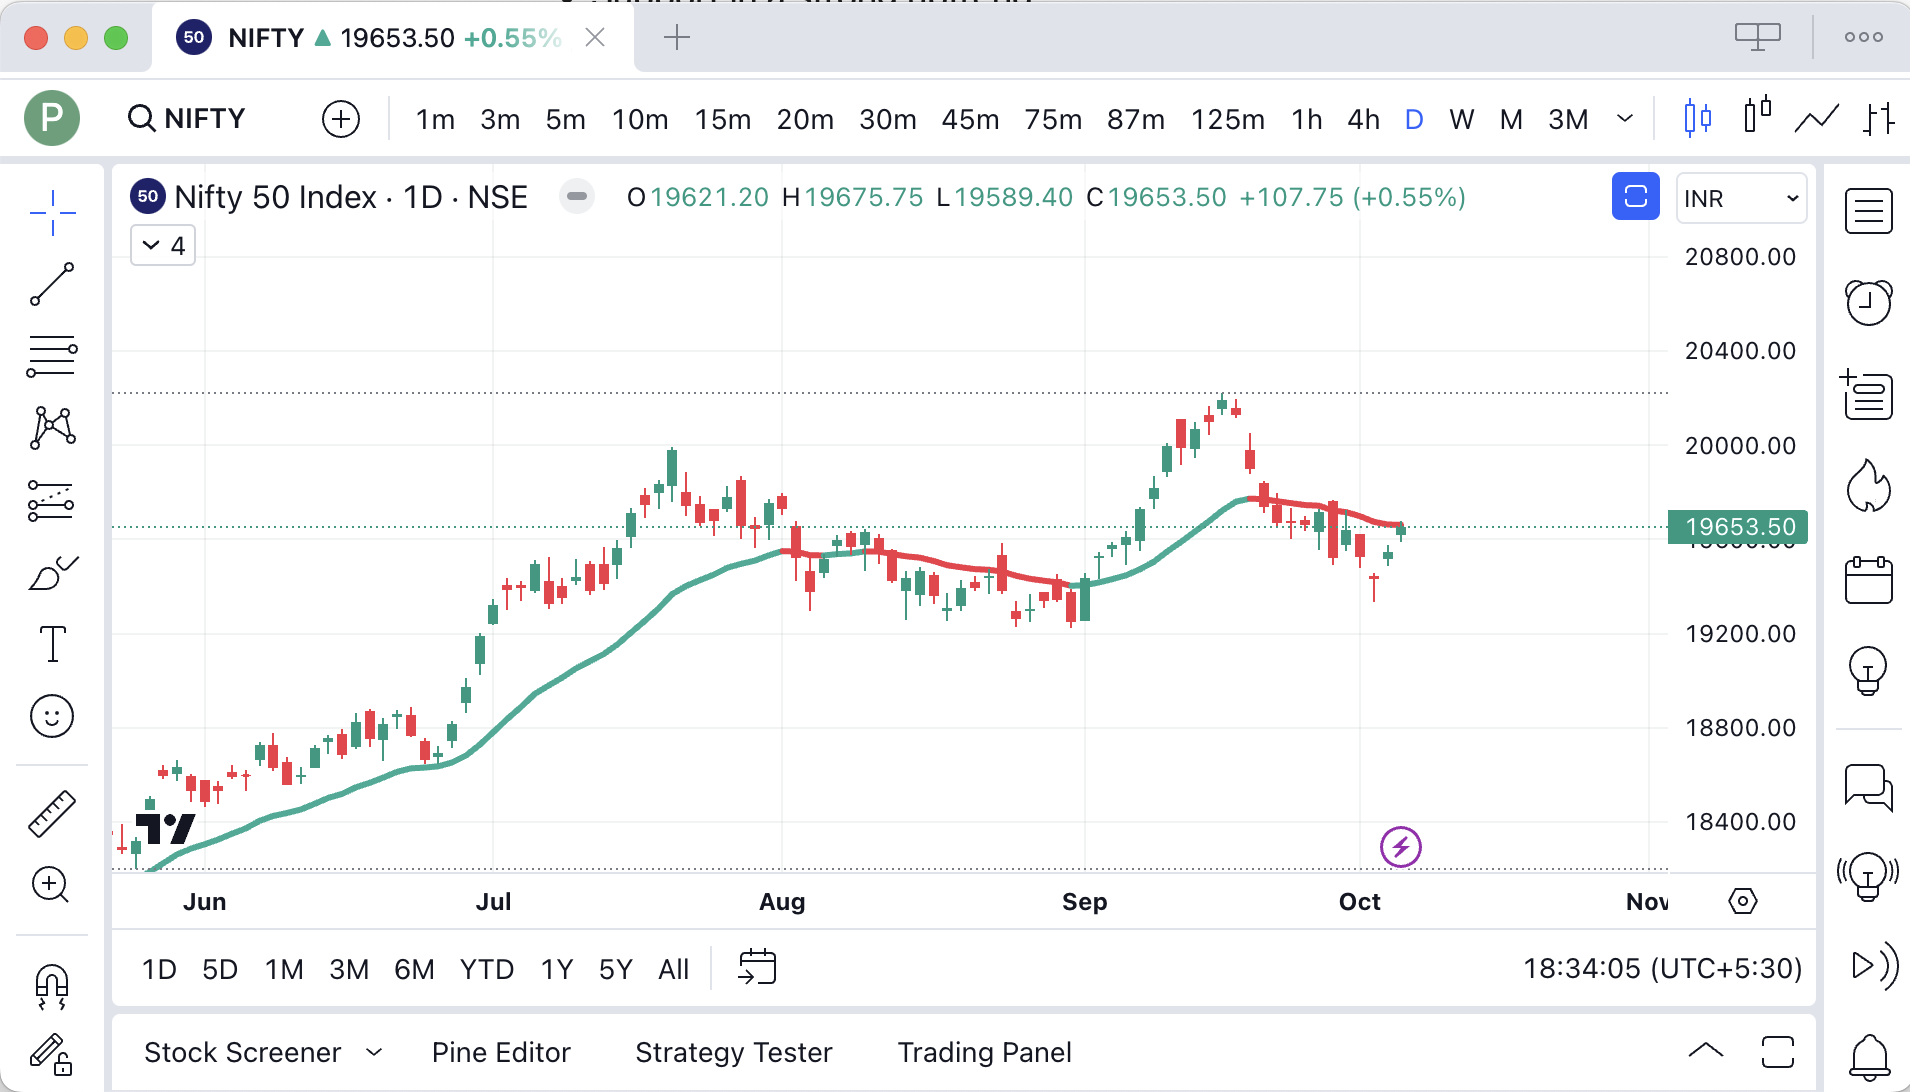
21 day EMA
- Intermediate-term Moving average
- The market always come back here - mean reversion in the market
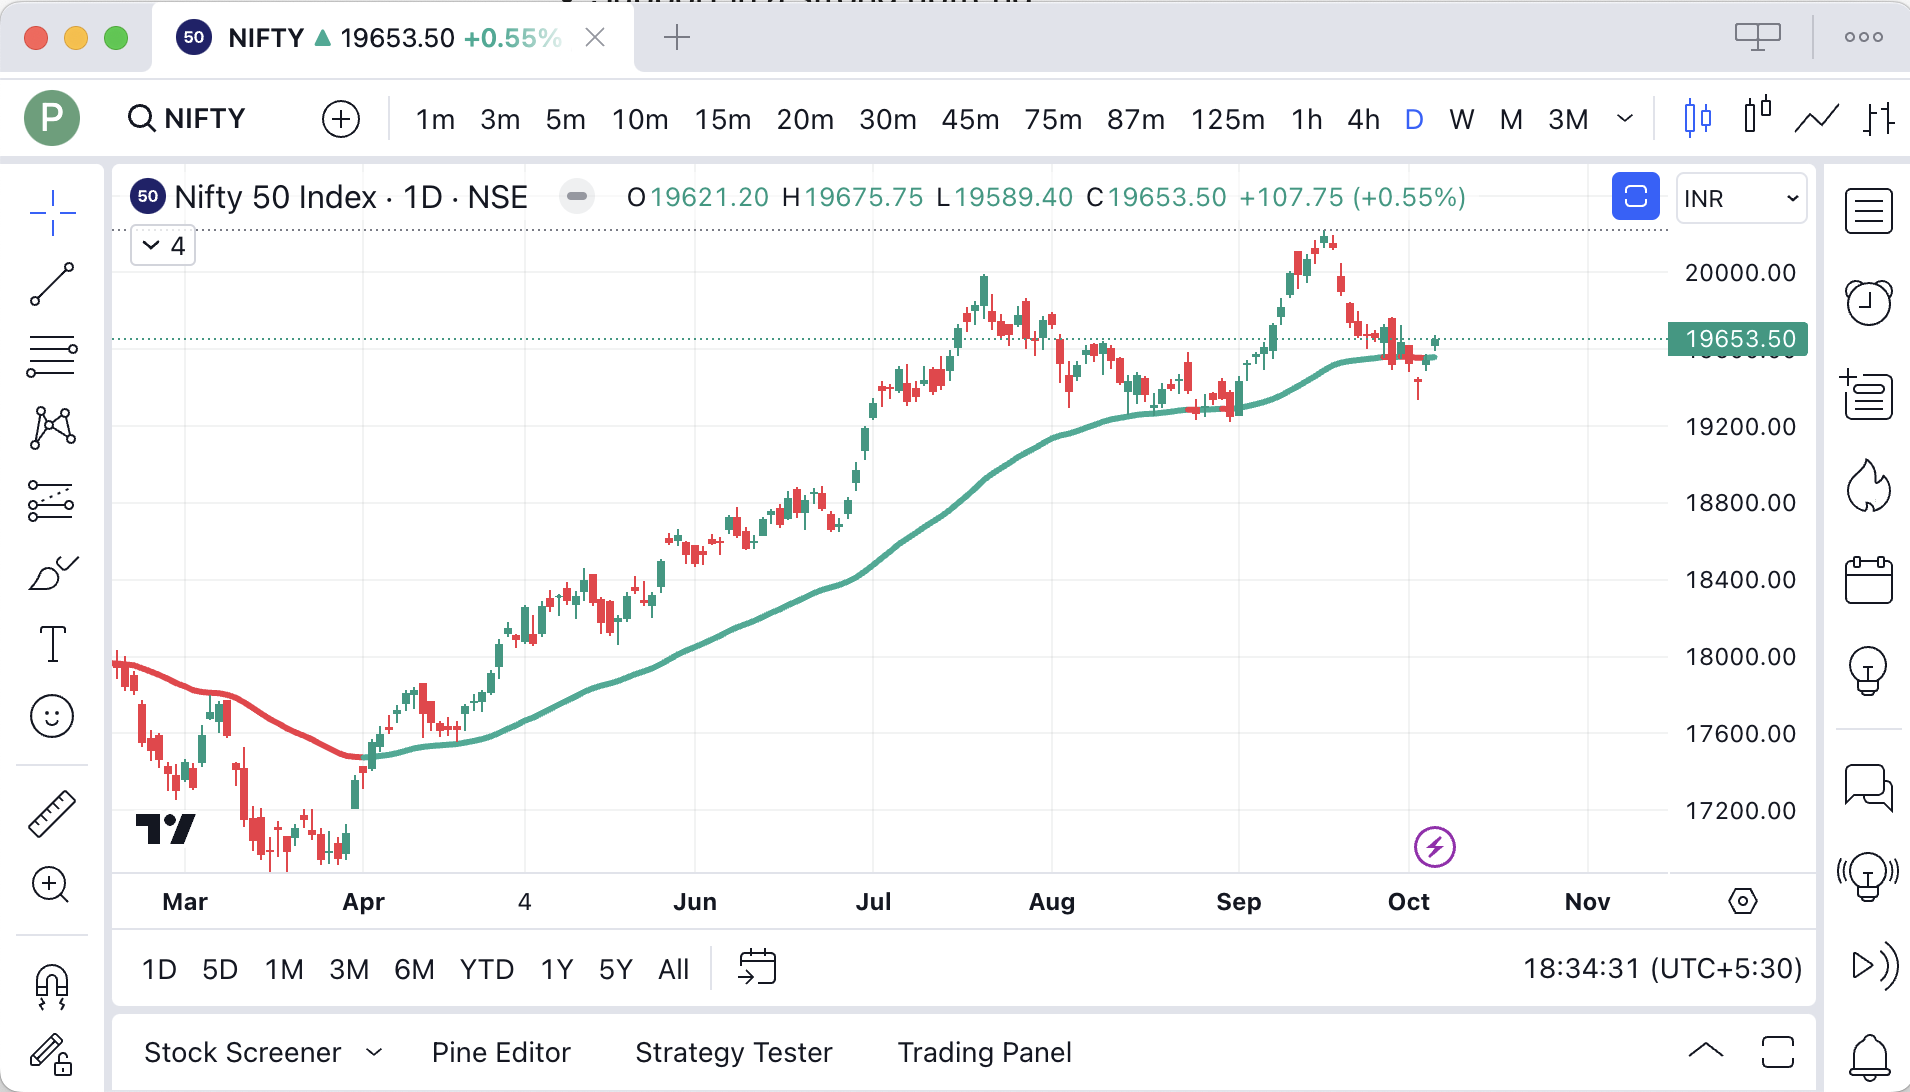
50 Day SMA
- Support for stock in an uptrend
- In the bull market its the pullback support line
- It’s great for the “Buy the dip” level
100 Day SMA
- The deeper pullback in the bull market
- It provides a good Risk Reward Ratio
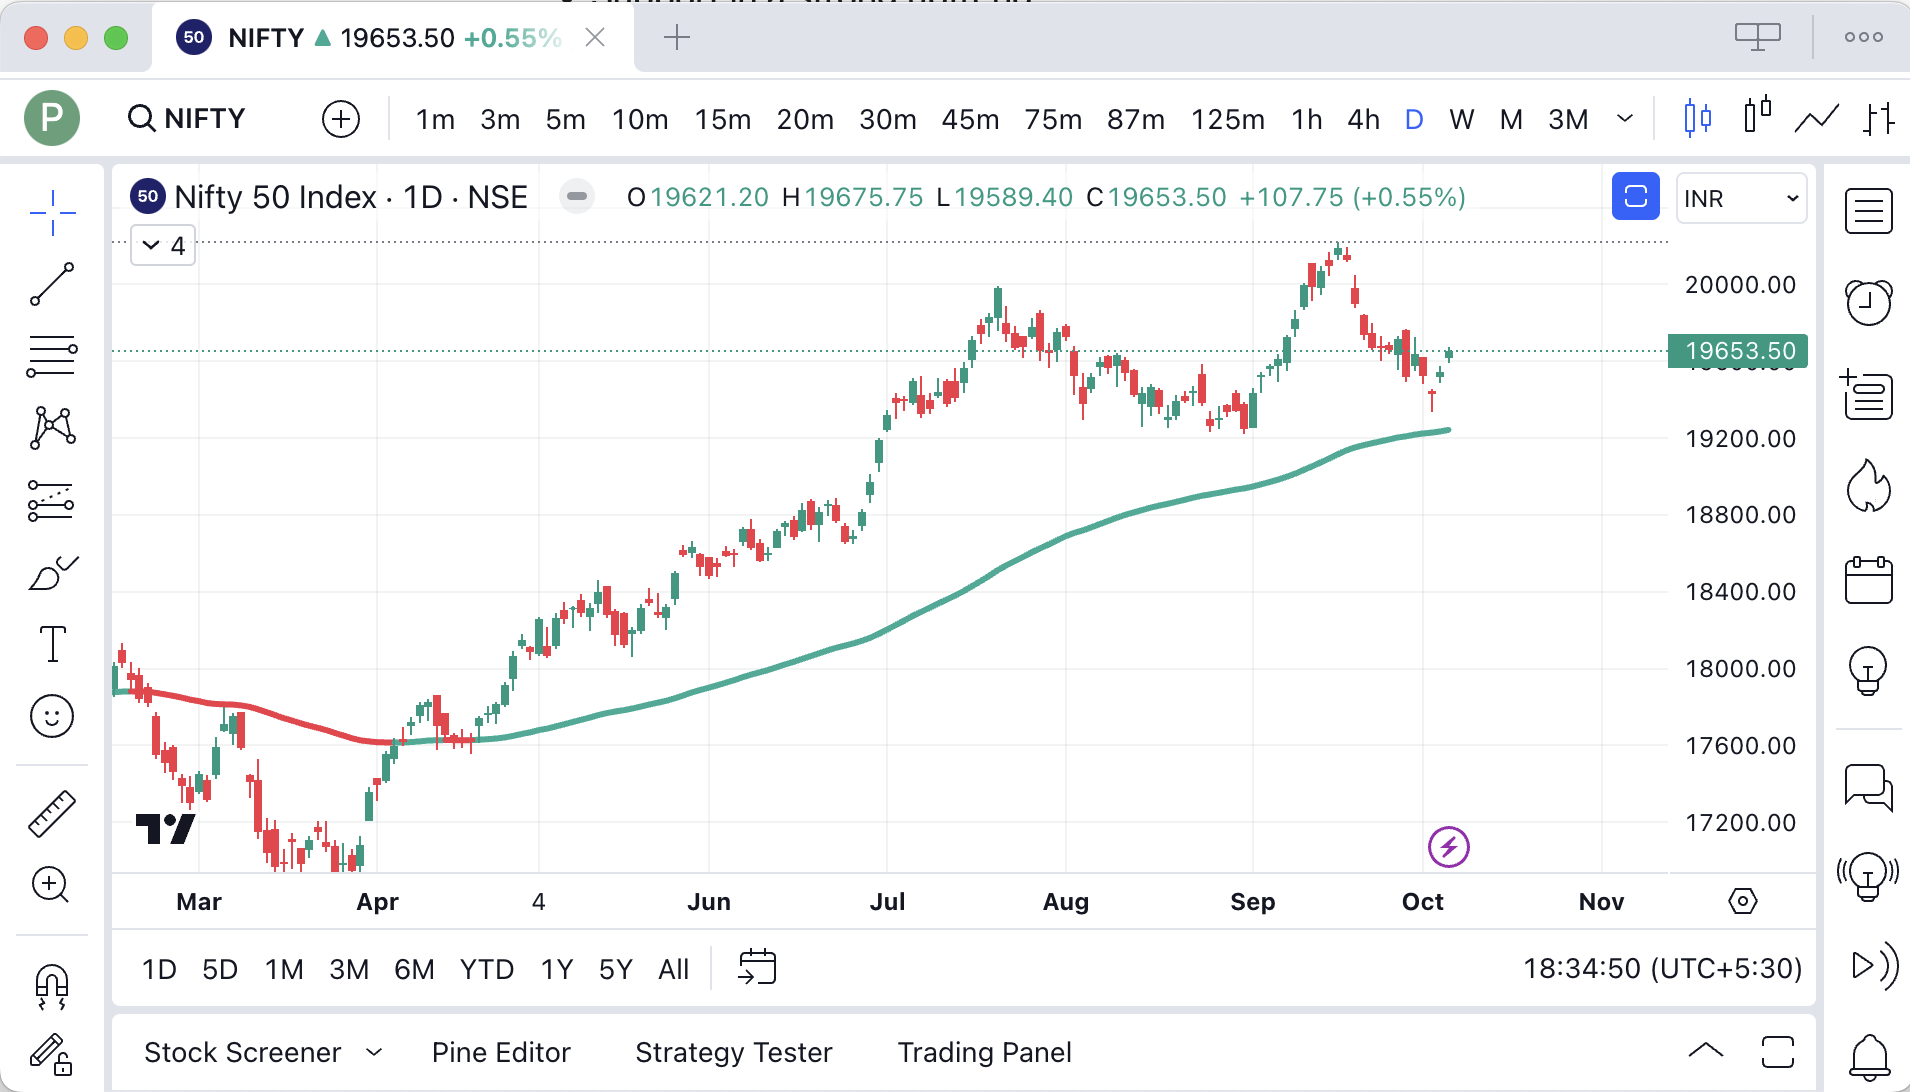
200 Days SMA
- Above 200 SMA its bull market go long only
- Below 200 SMA its bears market for short only
- Bull buy pullbacks to 200 SMA
- 200 SMA acts as a support and resistance line
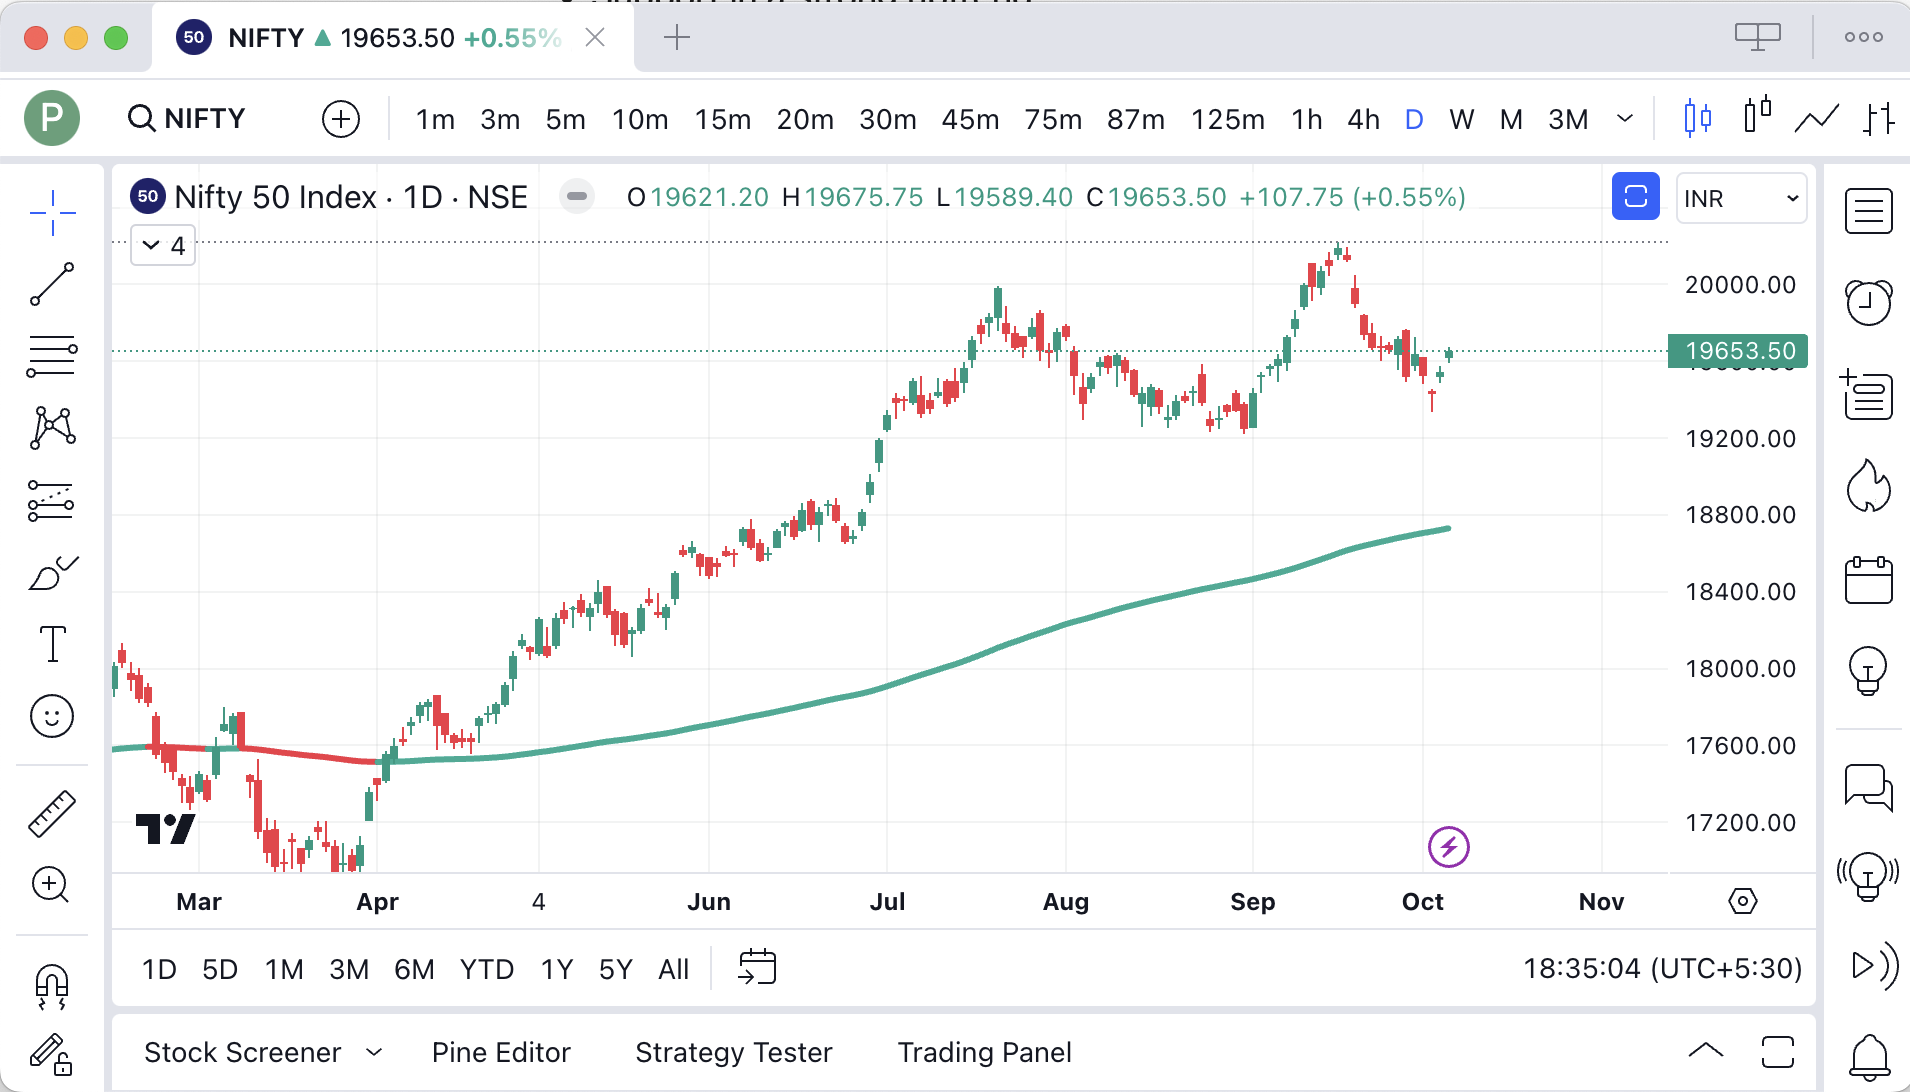
How to use Moving Average?
Signals for entering the trade
1. Price break above the key moving average on the daily chart is buying signal for the intraday
2. Price breaks and closes above the key moving average on the daily chart  is buying signal
3. Buying support as price pulls back and holds above the key moving average
4. Buying as price reverses the breaks above a key level after being on another side of the downtrend
5. Buying a pullback to supporting moving average in the trend
6. Buying when a shorter-term moving average crosses the longer term
7. Selling when a longer-term moving average crosses the shorter one
8. Selling short when MA acting as resistance in a downtrend
Keeping Stop Loss after entry
1. A Moving Average Crossover
2. Close position, if the key moving average is violated
3. Close position, if the price closes the wrong side of your moving average
4. Keep SL a few points away than the Moving Average Level
Keeping Trailing Stop Loss
1. If entry is based on 100 or 200 SMA then keep Trailing SL at  5 or 10 days SMA
2. Keep SL as previous days Low or High
Exit trade
1. Price crosses back to your initial moving average
2. Use RSI 70 or 80 level to exit the trade i.e Overbought
3. Exit if the price targets are achieved
5 Day EMA
- To capture a short term trend, if the price breaks above it
- Can be used with RSI for entry and exit
- Avoiding long entries in overbought, markets or short positions in oversold markets
- It can be used as an end of day trailing stop after entering on the signal of a longer term moving average.
- Enter using the 200 day SMA, and if the trade trends in your favor, exit and lock in profits after the 5 day EMA is lost and not recovered by the end of the day.
Using MACD and RSI for trade filtration
You take your crossover system long trades only when the MACD is on the right side of a bullish crossover.
You only take long crossovers when RSI is above 50 for momentum signals, and take sell short signals when RSI is under 50 showing a loss of momentum.
You do not take breakouts over key moving averages when RSI is over 65 due to the skewed risk/return ratio.
You could turn off your short sell signals when the market you are trading is over the 200 day SMA.
Enter on a break and close above the 200 day SMA, stop loss is a close back under the 200 day. If it trends the trailing stop could be a close back under the 10 day EMA with a target of the 65 RSI on the daily chart.
Enter a stock as it bounces off the 50 day SMA. Stop loss is a close back under the 50 day SMA. Trailing stop in a trend is a close under the 10 day EMA. Target is the 70 RSI.
Enter when a stock index is at a 34 RSI but still over the 200 day SMA. Your initial stop loss is a close below the 30 RSI. Your trailing stop is a close below the previous day’s low of day. Your target is the 50 RSI.
You take a short position in a stock index as it rallies back to the 51 RSI, but the market is under the 200 day SMA. Your stop loss is a close over the 54 RSI. Your trailing stop is the previous day’s high of day. Your target is to cover your short at the 32 RSI.
Popular moving average crossovers that are used.
Choose ones to test that are right for your time frame and market
To use a moving crossover system, enter when a short term moving average crosses over a longer term one and then exit when it crosses back over from the other direction
- 5 day SMA / 20 day SMA
- 5 day EMA / 50 day SMA
- 10 day EMA / 20 day EMA
- 10 day EMA / 50 day EMA
- 15 day EMA/ 30 day EMA
- 15 day EMA / 150 day EMA
- 10 day SMA / 200 day SMA
- 50 day SMA / 200 day SMA
Using a moving average crossover system instead of moving averages alone lowers the quantity of your trades, so it both increases your chance of capturing a longer trend, and it lowers your commission costs and churn rate of trades