In this lesson you will learn following memory management commands
- free - To check RAM status
- proc/meminfo - Detailed RAM status
- top - Process Management
- htop - Advanced Process Management
- df - Disk Free Space Details
- du - Disk Consumption Details
- vmstat - Virtual Memory Statistics
- demidecode - Systems Hardware Information
- sar - System Activity **Report
- pagesize - Virtual Page size information
free command
Free command is used to find out how much RAM is free and how much is used. It displays physical, swap, cache and buffers status
you can use following options to customize the display
- b - to display output in bytes
- k - to display in kilobytes
- m - to display in mebibytes
- g - to display in gibibytes
You can also use the -s option to display results for given seconds apart
Example1 : Display memory status in megabtes
Meaning of each column
- total : Total full available RAM memory size
- used : Amount of RAM currently used by the processes
- free : Free memory i.e. Available - Used
- shared : memory used in tmpfs to for creating the virtual memory
- buff/cache : Memory used by cache and kernel buffers
- available : memory available to run more applications
Example2: Display memory status in every second in gegabytes format
/proc/meminfo
Under /proc directory we have meminfo file, this file give lot of information about your systems RAM memory.
You can use cat or nano to display the content of this file. Actually this file is created in the memory by OS to give all the information about the system.
Sample output of meminfo file is shown below
| |
We will not go through all the attributes of the above file, you need to know th concepts of Operating System to understand the menaing of all the attributes.
In this file you will get total RAM size, total swap memory, consumed, free, available to use, memory page mappings, virtual memory allocations, dirty pages, swapped memory etc.
For more information you can visit : https://access.redhat.com/documentation/en-us/red_hat_enterprise_linux/6/html/deployment_guide/s2-proc-meminfo
top
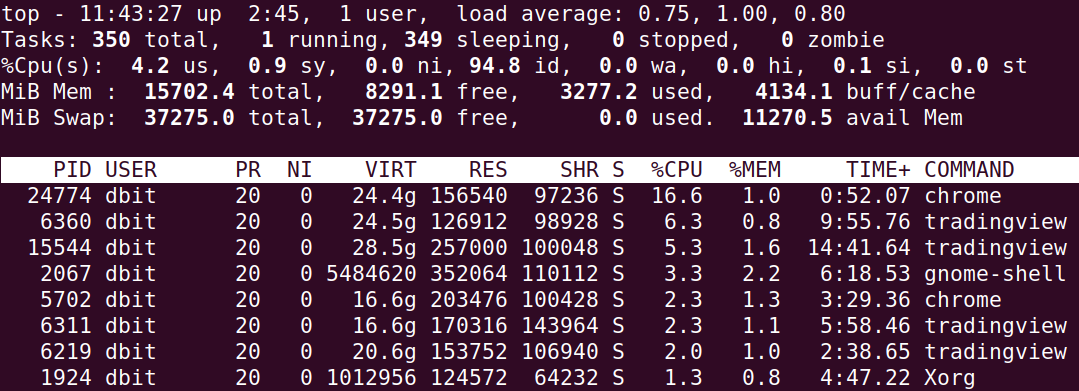
top is used to display the process running in the system. When you run the top command you get following output

Top displays following information on first few lines
- Current time and sinceh when system booted
- Total numers of users logged in
- system load over 1,5 and 15 min
- How many tasks/processes are running and their states
- CPU utilization and their categories of usage as shown following
- us, user : time running un-niced user processes
- sy, system : time running kernel processes
- ni, nice : time running niced user processes
- id, idle : time spent in the kernel idle handler
- wa, IO-wait : time waiting for I/O completion
- hi : time spent servicing hardware interrupts
- si : time spent servicing software interrupts
- st : time stolen from this vm by the hypervisor
- Physical Memory usage information like total, free, used and buff/cache
- Swap memory usage information like total, free, used and avail
As you can see in the output, get following information in the colums
- PID - Process identifier
- USER - User who started or Owner of process
- PRI - Process priority for kernel
- NI - Process priority set by user or root
- VIRT - Vrtual memory consumed by process
- RES - Physical memory consumed by the process
- SHR - Shared memory consumed by the process
- S - State of the process
- CPU% - % CPU utilization by the process
- MEM% - % of Memory consumption by the process
- TIME+ - time since the process started the execution
- Command - Command path which started the execution of the process
Process states :
- D = uninterruptible sleep
- I = idle
- R = running
- S = sleeping
- T = stopped by job control signal
- t = stopped by debugger during trace
- Z = zombie
htop

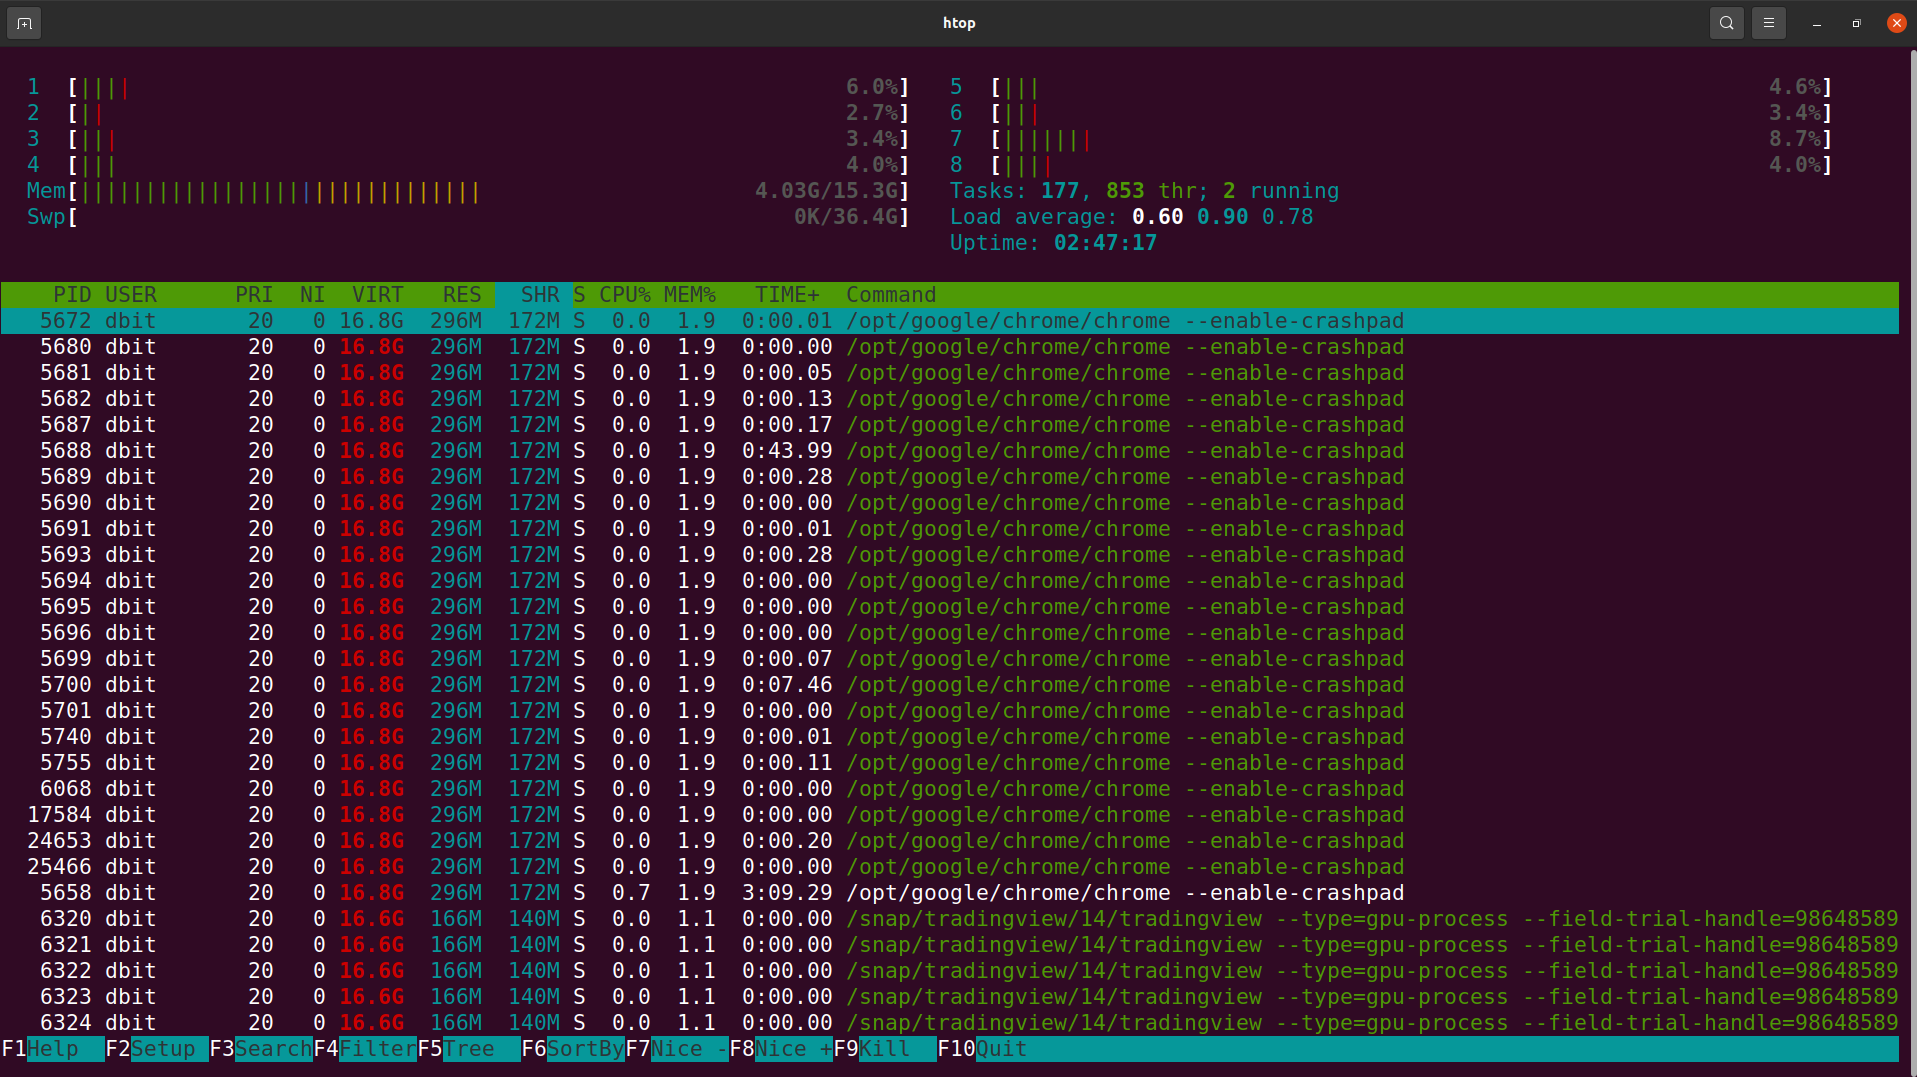
Htop is advanced process monitoring command siliar to top but it gives more advanced interactive features.
Htop has similar colum out put as top command along with this is shows information about the individual cpu utilizations on top.
You can use the keyboard to do various additional operations like
- Use arrow keys to scroll through processes like left, right, home etc
- Use function keys to search, filter, sort, change priority and kill processes.
df
df is stands for disk space, df can se used to find out all about the consumption of the disk space
Lets see what df gives as a output
| |
You will get lots of snap applications also in the output you can simple remove it by using any filteration techniques like
| |
Lets now understand the output of df command,
- filesystem type using -t you can specify the which fs to filter in output
- 1K-blocks is nothing but the size of disk space in blocks, Use -H to get in human readable format
- Used and Available are current space stats
- % use is nothing but how much % its used out of availabe and
- Mounted on is nothing but the mount point in which the drive/partition is mounted
Example of filtering based on etx4 type
Use -h to see the file system size in power of 1024
Now lets see how to fnd the space of a particular directory
Dont forget to put -h to get the K, M and G in the output so that you can understand it easily
du
du is disk usage, it is used to find out how much space is used by files and directories. Not df is for disk availablity not for files space estimations.
lets see examples and understand more about the du command
du also by default gives output in the blocks format, make it human readable using -h option as shown below
You can use -c to get the grand total of the directory, Its alsho seen using -h options also
You can use the sort and head to filter out the top biggest directories or files using following
We use -a to list all files and directries -h to get in human redable format -n to sort using numerical values -r to reverse the result i.e biggest on top -n to specify only 5 lines of output
Using -d you specify the how much depth you want display in the output
Please note -d option needs the depth parameter, other parameters you need to specify before that
vmstat
vmstat is used to report the virtual memory stats, like reads, writes cpu. Along with it it also gives cpu utilization details.
Read the column informatin in its man pages.
| |
demidecode
demidecode is used to display Processor, RAM(DIMMs), BIOS detail, Memory, Serial number information.
dmi is nothing but Desktop Management Interface. It reads from DMI table.
| |
sar
Sar stands for system activty report. Using sar you can see
- CPU usage
- Memory utilization
- I/O devices consumption
- Network monitoring
- Disk usage
- Process and thread allocation
- Battery performance
- Plug and play devices
- Processor performance
- File system etc
Install sar with sudo apt install sysstat if not installed by default.
After installation we need to enable it using systemctl start sysstat.service
Report CPU details total 5 times with the interval of 2 seconds
sar -u 2 5Report about the amount of memory used, amount of memory free, available cache, available buffers total 3 times with the interval of 1 second.
sar -r 1 3report about file systems mounted on the device
sar -F 2 5Report Paging stats
sar -B 2 5Report about the bloc devices
sar -d 1 3
You can explore more about the sar and its output in its man page
pagesize
In Linux RAM is divided into pages, and then based on it pages are allocated to the application programs. Using pagesize command you can get the page size set for your system
If this program is not installed by default then you can install using sudo apt install libhugetlbfs-bin
You cna get the same output using the getconf PAGESIZE also
If you use -a then you can get it huge page size also